Key benefits of the generated HTML reports
- HTML and SVG format – high quality format of the graphics and lines.
- Easy-to-view – no server required, reports work perfectly in the local environment. Click on the index.html file to view the report. It’s that simple.
- Easy-to-share – zip the report and send it to a colleague, or upload the report to your server and then embed the files on your favorite site using the IFRAME tag.
How to create a data model report
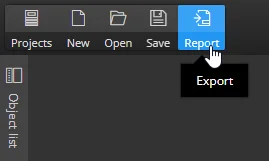
To create a new report, open your project and click on the Report button on the main toolbar
Select the report style
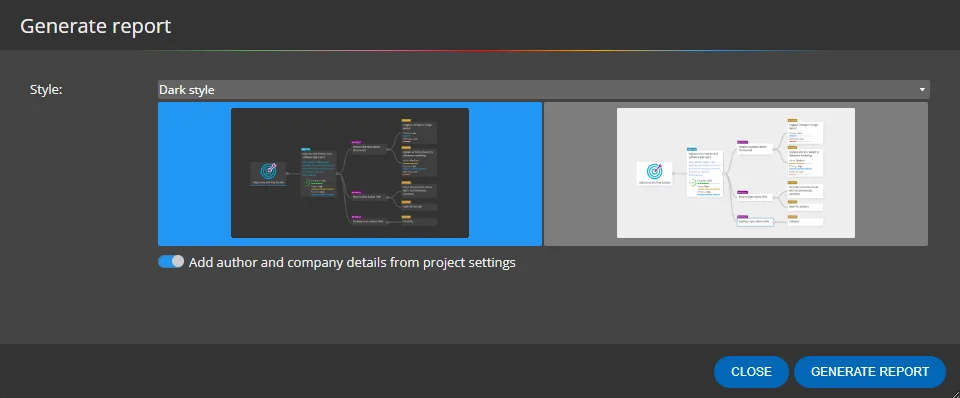
Select the target folder and generate the report.
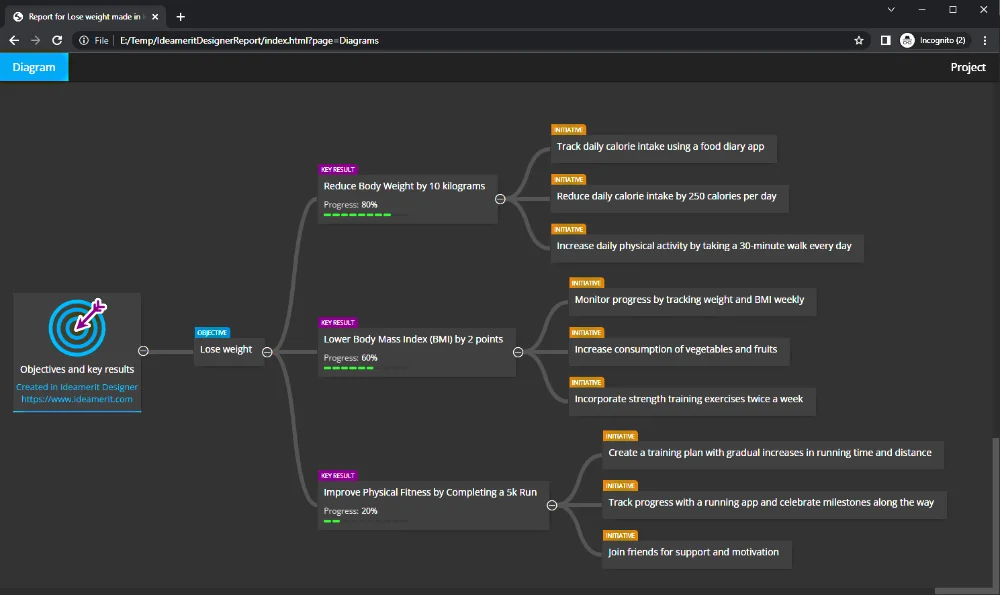
Example of generated report:
How to add the generated report to other sites?
Use the IFRAME tag. This might be the easiest way how to add the report to e.g. Atlassian Confluence.
#